

Geography
Visualising the Earth
Maps are among the most familiar visualisations, but also among the most misleading. Every flat world map distorts something — be it areas, angles, distances or directions — because it is impossible to lay out a sphere on a plane without stretching it somewhere. The choice of which property to preserve and which to sacrifice is rarely made explicit to the reader of a map.
In September 2026, the UN General Assembly adopted resolution A/RES/80/307. This resolution encourages the use of equal-area projections, such as Equal Earth, wherever relative size is important. It also asks that the limitations of flat world maps are addressed in teaching.
A Geography Extension
JSXGraph GEO is an extension that adds two elements to JSXGraph. It is not part of the core library and must be loaded separately.

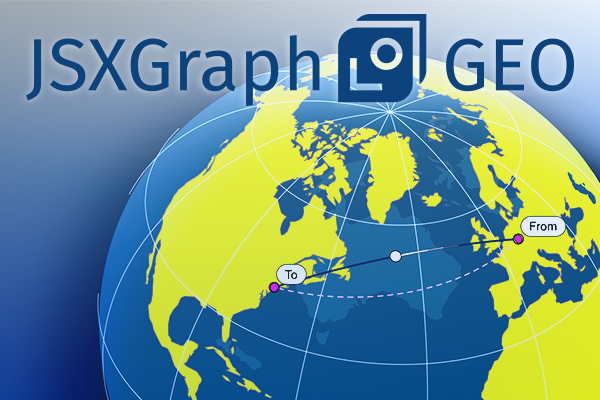
globe3d keeps the geometry on the sphere. It inherits from View3D, meaning the globe shares its coordinate space with any other three-dimensional construction. The result is a perspective view of a sphere, with the usual consequences: foreshortening towards the rim and half of the Earth always being turned away.
geomap draws the Earth on a plane using one of twelve different projections. While the map is running, the projection can be exchanged; the layers move into their new positions rather than jumping, making the difference between two projections visible as a transformation rather than as two separate images.
Projections
The extension includes twelve projections, which are grouped according to the property they preserve. These are equal-area projections (Equal Earth, Mollweide, Hammer, sinusoidal and Lambert azimuthal), conformal projections (Mercator and stereographic), equidistant projections (plate carrée and azimuthal equidistant) and compromise projections (Robinson and Winkel Tripel). There is also a perspective projection (orthographic).
Drawable elements
There are sixteen elements that can be drawn on a map or globe: points, paths, markers with trails, labels, handles, polygons, spherical triangles, regions, freehand sketches, orbits with ground tracks, range rings, the day-and-night terminator, time zones, and reference lines such as the equator, tropics, and date line.
Use in teaching and assessment
As every interaction returns a value rather than just an image, the elements can be used for assessment as well as illustration. Clicking on a country yields its identifier, placing a point yields its coordinates, and drawing a route or outlining a region yields the length in kilometres or the area in square kilometres. These values can be automatically checked, with tolerance applied where appropriate.
The geographic data is bundled with the extension rather than being fetched from a tile server. Once the page has loaded, no network connection is required, which is important in examination settings and in networks with restricted access.
Availability
This is the first version. The limitations are documented alongside the relevant code: measurements are spherical rather than ellipsoidal; the dataset is generalised on a global scale; and orbits are Keplerian circles.